Hide minor edits - Show changes to markup
Assignments over the word/page limit will receive a penalty of 10% or only be graded up to the word/page limit, at the discretion of the instructor.
3% Results:
1.5% Discussion 0.5% Conclusion
Grading:
3% Results:
1.5% Discussion
0.5% Conclusion
You only need to report results and conduct descriptive and inferential statistics for H1 and H2. You can exclude H3 and H4. You also do not need to conduct any tests to see that it is okay to use ANOVAs (e.g., testing the various assumptions that ANOVAs rely on). Those who have a background in quantitative methods and statistical analysis are encouraged to work through the analysis for H3 and H4 as a learning opportunity.
You only need to report results and conduct descriptive and inferential statistics for H1 and H2. You can exclude H3 and H4. You also do not need to conduct any tests to see that it is okay to use ANOVAs (e.g., testing the various assumptions that ANOVAs rely on). Those who have a background in quantitative methods and statistical analysis are encouraged to work through the analysis for H3 and H4 as a learning opportunity, though no additional credit will be given for completing them.
You only need to conduct descriptive and inferential statistics for H1 and H2. You can exclude H3 and H4. You also do not need to conduct any tests to see that it is okay to use ANOVAs? (e.g., testing the various assumptions that ANOVAs? rely on).
Scope: You only need to report results and conduct descriptive and inferential statistics for H1 and H2. You can exclude H3 and H4. You also do not need to conduct any tests to see that it is okay to use ANOVAs (e.g., testing the various assumptions that ANOVAs rely on). Those who have a background in quantitative methods and statistical analysis are encouraged to work through the analysis for H3 and H4 as a learning opportunity.
Create a paper that contains the write-ups from above. Submit a paper copy in class and a copy over email (send a PDF as well as the source files, e.g., docx, latex). You should use ACM CHI 2016 format and style for your writing, which will require you to reformat the sample paper and references above.
Create a paper that contains the write-ups from above. You should use the same format as the start of the paper, which is given above. Submit a paper copy in class.
Assignment 4a: Experimental Approaches (5%)
Assignment 3a: Experimental Approaches (5%)
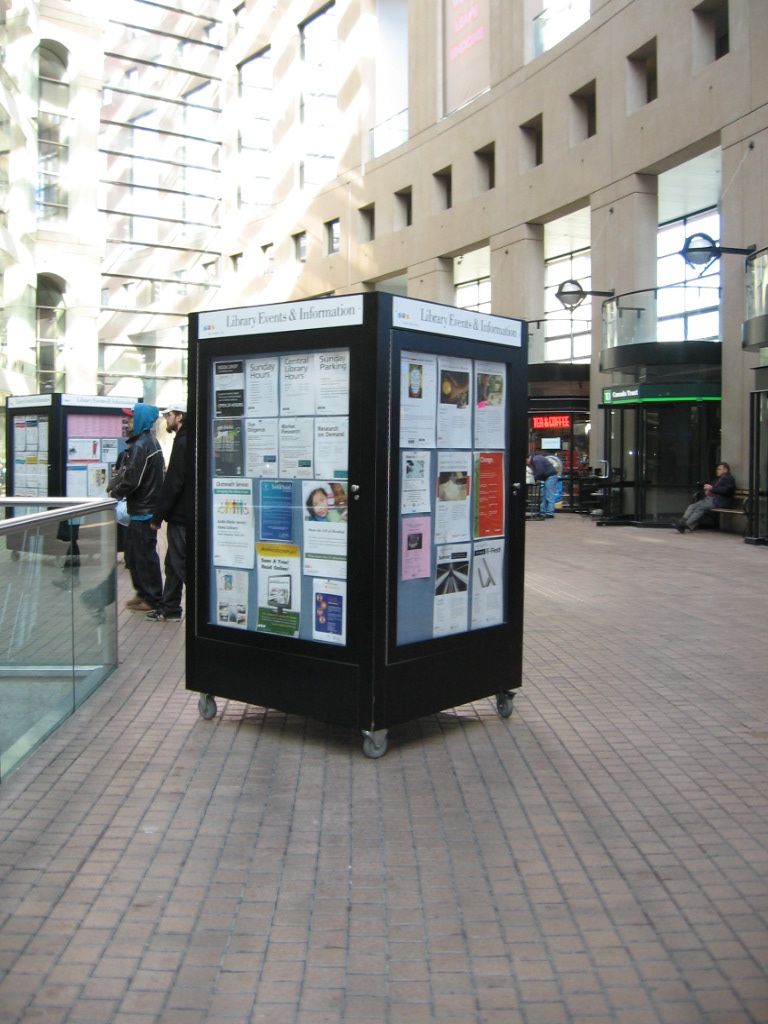
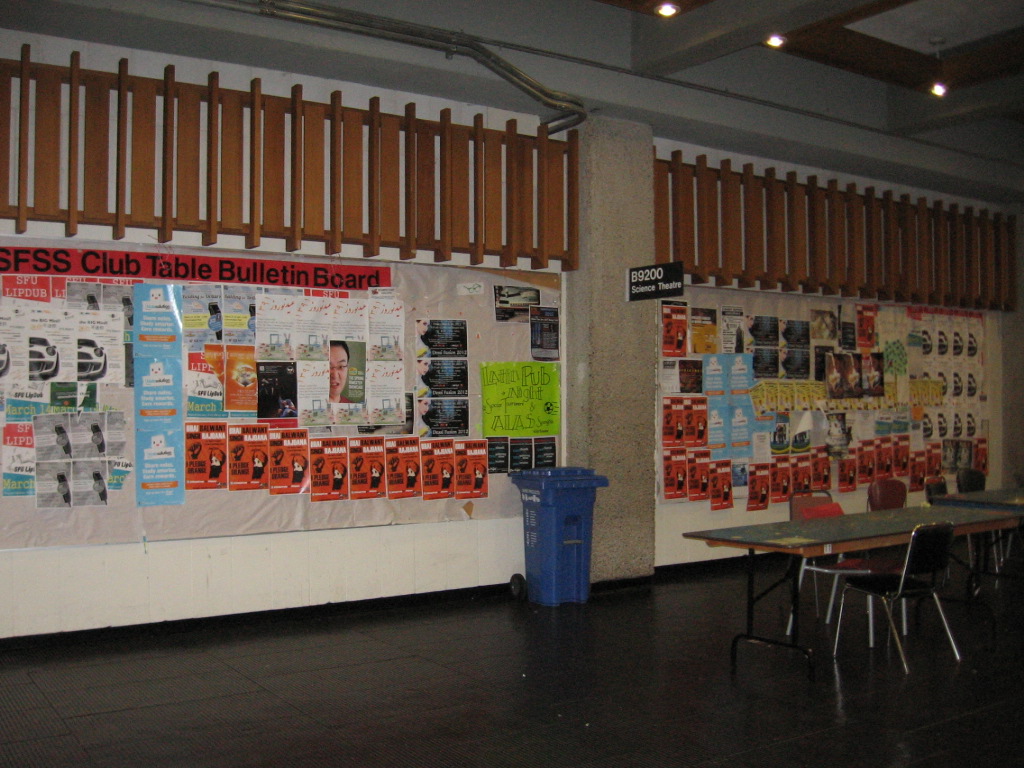
1. Observe and collect data for three bulletin boards. This includes capturing high resolution images of the bulletin boards. Count the number of postings on each bulletin board and label each post in terms of what type of post it is. The original study generated post categories organically through an open coding process, however, you will use the following set of categories based on that analysis. For each bulletin board, count how many postings fit in each category. The categories are:
2. Observe the setting around the bulletin board including the location, the people around it, and people's activities. Take observational notes of what you see.
3. Write a short results section for your findings (max one page) where you answer these questions. Each question should be answered in its own subsection and include a one paragraph answer, plus descriptions of data that provide evidence for your answer.
4. Write a short discussion section for your findings where you list out 3 to 5 implications that your results point to for the design of digital bulletin boards. That is, if a person was going to design a digital bulletin board, what lessons can be drawn from your study to suggest how the digital bulletin board should be designed? Your discussion section should be no more than 1 page. For each implication, you should give rationale for choosing it based on your analysis.
5. Include images of the bulletin boards you observed as part of an appendix.
1. Read the paper, familiarize yourself with main research question, four hypotheses, and independent and dependent variables.
2. Review the data files and the data analysis plan. Make sure you are clear on which data should be used to address which hypothesis.
3. Import the data into the statistics package(s) you are using. Based on the guidance provided, run exploratory plots, and descriptive and inferential statistics, saving a separate output file for each hypotheses.
4. Review the output files looking for evidence to address each hypothesis.
5. Write a short results section for your findings (max two pages) structured by hypotheses. Each hypothesis should be addressed in its own subsection and include descriptive and inferential results that provide evidence to support or refute the hypothesis. Include graphs with error bars to show significant results.
6. Write a short discussion section for your findings where you synthesize the results to address the overarching research question, providing an assessment of the effectiveness of the neurofeedback application as it was used in this intervention. Include a brief discussion of limitations. Your discussion section should be no more than 1 page.
7. Write a short conclusion providing the main contribution of the work, and suggestions for future work.
Create a paper that contains the write-ups from above. Submit a paper copy in class and a copy over email (send a PDF as well as the source files, e.g., docx, latex). You should use the same paper format / style for your writing as the sample paper above (ACM CHI format).
Create a paper that contains the write-ups from above. Submit a paper copy in class and a copy over email (send a PDF as well as the source files, e.g., docx, latex). You should use ACM CHI 2016 format and style for your writing, which will require you to reformat the sample paper and references above.
1. The introduction, related work, and part of the study methods sections of a paper describing your experimental study - (Word file, PDF file) 2. An export of the Zotero references library for the paper (rdf file) 3. The cleaned up excel data files for all four dependent variables in SPSS and JMP formats. 4. Download SPSS or use it on a campus PC (SPSS can be used for all analysis) and/or JMP (which can be used for descriptive but not inferential analysis). 5. The study design and data analysis plan document. 6. A web site about the neurofeedback system 7. A video of the Stones sustained attention game 8. A video about the SART attention test.
You have been tasked with conducting an observational study that explores a particular phenomena in everyday society. This particular study uses a design ethnography approach. You will review the background of the study, including the context and the research problems, the specific data collection methods used, and the analysis procedures to follow. Then you'll complete the study, albeit in a limited form.
You have been tasked with conducting an experimental study that explores if a game-based neurofeedback application can effectively support people to improve their ability to self-regulate their attention used as an intervention in a single session. This study uses a mixed within-between experiment. The independent variables are intervention/control group (between groups) and assessment time point (within groups). One group of participants used the real neurofeedback application and the second group (control) used a sham version of the neurofeedback application. The dependent variables include a two part attentional test, the average attentive brainwave values during game play, and a self-report survey. Measures were administered at different time points in the study.
You will review the background of the study, including the context and the research problems, the specific data collection methods used, and the analysis procedures to follow. Then you'll run the analysis, interpret your results in light of four hypotheses and write a discussion.
1. The introduction, related work, and part of the study methods sections of a paper describing your experimental study - (Word file, PDF file) 2. An export of the Zotero references library for the paper (rdf file) 3. The cleaned up excel data files for all four dependent variables in SPSS and JMP formats. 4. Download SPSS or use it on a campus PC (SPSS can be used for all analysis) and/or JMP (which can be used for descriptive but not inferential analysis). 5. The study design and data analysis plan document. 6. A web site about the neurofeedback system 7. A video of the Stones sustained attention game 8. A video about the SART attention test.
Assignment 4a: Experimental Approaches (5%)
You have been tasked with conducting an observational study that explores a particular phenomena in everyday society. This particular study uses a design ethnography approach. You will review the background of the study, including the context and the research problems, the specific data collection methods used, and the analysis procedures to follow. Then you'll complete the study, albeit in a limited form.
Materials:
Tasks:
1. Observe and collect data for three bulletin boards. This includes capturing high resolution images of the bulletin boards. Count the number of postings on each bulletin board and label each post in terms of what type of post it is. The original study generated post categories organically through an open coding process, however, you will use the following set of categories based on that analysis. For each bulletin board, count how many postings fit in each category. The categories are:
2. Observe the setting around the bulletin board including the location, the people around it, and people's activities. Take observational notes of what you see.
3. Write a short results section for your findings (max one page) where you answer these questions. Each question should be answered in its own subsection and include a one paragraph answer, plus descriptions of data that provide evidence for your answer.
4. Write a short discussion section for your findings where you list out 3 to 5 implications that your results point to for the design of digital bulletin boards. That is, if a person was going to design a digital bulletin board, what lessons can be drawn from your study to suggest how the digital bulletin board should be designed? Your discussion section should be no more than 1 page. For each implication, you should give rationale for choosing it based on your analysis.
5. Include images of the bulletin boards you observed as part of an appendix.
Submission:
Create a paper that contains the write-ups from above. Submit a paper copy in class and a copy over email (send a PDF as well as the source files, e.g., docx, latex). You should use the same paper format / style for your writing as the sample paper above (ACM CHI format).